While making a machine learning model there are very common mistakes that a programmer does which have severe effects on the performance of the model. In this tutorial, we will learn about those mistakes and how to deal with them.
Some of the common pitfalls are:
- Poor Data
- Overfitting
- Underfitting
- Selection of error metric
- Data Leakage
Poor Data
In Machine Learning it is said that you get, what you put in which means if we give our algorithm a poor data the result will automatically be poor. Poor data can be -:
- Not Enough Data.
- Data may be imbalanced.
- Missing Values may be present.
- Less information (Less Variables).
- Outliers may be present in the data.
So before getting started it is compulsory to thoroughly study the data and perform some operations to check for missing entries or make the data untidy. This seems a boring task but it is necessary to get the correct end results.
Using the .info() method of pandas Dataframe is one of the methods to check for missing entries in the dataset.
Overfitting
Many a time while building an ML model our model suffers from a problem called Overfitting. This is a very serious problem as it will look like your model has given great results when looking through training data but when the algorithm will be tested with test data the result will be really poor.
It is said that if we have too many features or less training examples then the learned hypothesis may fit the training set very well but fail to generalize to new examples ( prediction on new examples). This is called Overfitting or High Variance problem. It simply means that our model has overfitted the training data.
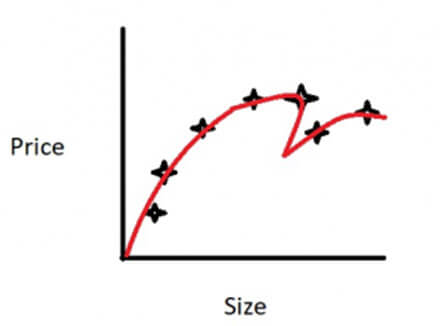
The above picture shows an overfitted curve and it is clear from the picture that our model is trying too hard to fit the training data.
To solve the problem of overfitting we can take the following steps.
- Reduce the number of features - We can manually select the which features to keep that is, according to our problem we can keep only the useful variables and discard the rest or we can also try to change the model selection algorithm.
- Regularization - Regularization is the process by which we keep all the variables in the dataset but reduce the magnitude/ values of parameters (Theta). It works well when we have a lot of features, each of which contributes to predicting our output variable.
Underfitting
It is just opposite to overfitting, underfitting is also a common problem in which our model has not fitted the training data well or it has not learned the data well. In this problem, the result of both training data as well as test data comes out poor. So it is easier to find if our model is suffering from underfitting. Underfitting is also known as High Bias problem.
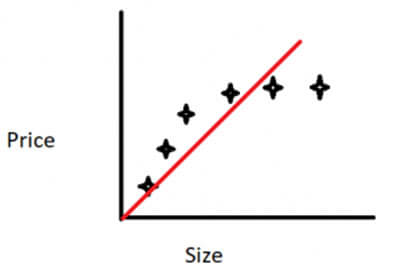
The above graph shows an underfitting curve.
To solve the problem of overfitting we can take the following steps.
- Try getting additional features.
- Try adding polynomial features.
- try decreasing lambda( Regularization parameter).
Selection of Error Metric:
Error Metric is used to get error result as a single, numeric value. Otherwise, it is difficult to assess your algorithm performance. most of the decision are taken On the basis of the result of the error metric, for example, Selection of more variables, adding polynomial features, or decreasing lambda. There are many types of error metric available, so the selection of the right error metric for a particular task is very important, for example,
Suppose we are working with skewed classes or imbalanced data that is when we have the dominance of a particular class in the dataset which means there is a very large number of entries for a particular class and the other class has very less number of entries. This will create a problem as the result will be partial. In this type of datasets simple error metric that is, classification accuracy would be a wrong way. So for this type of cases, we should go with Precision Recall evaluation metric.
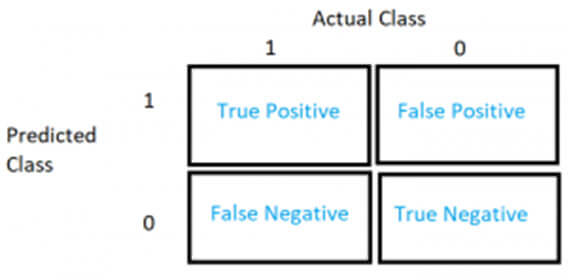
- True Positive - Number of classes which we predicted as Positive or 1 and that were actually 1.
- True Negative - Number of classes which we predicted as Negative or 0 and that were actually 0.
- False Positive - Number of classes that we predicted as Positive or 1 but they were actually 0.
- False Negative - Number of classes that we predicted as Negative or 0 but they were actually 1.
Now from this data, we calculate Precision and Recall.
Precision - Of all the data where we predicted y=1 what fraction is actually 1. Precision is equal to True Positive divided by predicted positive.
True Positive / (True Positive + False Positive)
Recall - Of all the data that actually are 1, what fraction did we predict 1. The recall is equal to True Positive divided by Actual Positive.
True Positive / ( True positives + False Negative)
In the same way, there are many other Evaluation Metric for different types of data problem.
Data Leakage
When developing prediction model Data Leakage is a serious problem as it will make your model to learn something that it should not learn. Data Leakage makes machine learning model overly optimistic if not completely invalid. Data Leakage happens when we add some additional information in our training dataset which disturbs the performance of the model.
This additional information is the feature or variable that would not be there when we will use our testset or when we will want our model to predict something in real. This additional feature cause leakage in our model. Or we can say that if our training data has information that we are trying to predict.
We can tell if our model is suffering from data leakage by checking the performance of our model that is if our model is achieving the results that seem little too good to be true.
Data leakage generally happens in the complex dataset
- Time series datasets.
- Sound and image data
- Graph problems
Let’s explore little bit of code for how to handle overfitting and underfitting for the above cases -:
Import the libraries
#pandas is for data manipulation
#numpy is for numerical calculations
#matplotlib for plots
#mglearn is for datasets
Making the dataset
Splitting the dataset in train and test data
Fitting the dataset to knn Regressor
Predicting the test data
Calculating the score of our prediction
Ploting result of various regressor having n_neighbors = 1, 3, 9
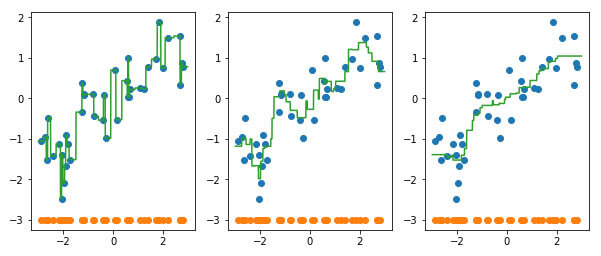
Observation:
1st plot shows that model has overfitted the data, 2nd plot shows the good fit, 3rd plot shows that model has underfitted the data
Conclusion:
By summing up all the above mentioned points, you get to know that these are some common pitfalls. There can be some more as well but you have to check the above mentioned pitfalls and should work on this while solving any machine learning problem for any Offshore software Development company.
Hope it gives you a clear picture of that.