In this article, we will see edge detection using OpenCV and how to detect edges in an image. You must be thinking of what is the need for that. But there is a lot of requirement to make just outlines and boxes during image processing mainly. In machine learning technology itself, there is a lot of requirement while solving some computer vision tasks.
If you have heard about a convolutional neural network, it is a huge network, and one layer of it also detects edges must be using some optimized approach. But let’s walk through a simple approach using the OpenCV concept of Image gradients.
What Are Image Gradients?
Let’s talk a little bit about Image Gradients as you must be getting an idea of its application of majorly detecting edges. In image gradients, we calculate the derivative of the whole image matrix in either horizontal or vertical or in both ways.
Calculating the gradient results in a matrix that designs a pointed part of the original image.
Image gradients type
Sobel
It will find the edges in either direction. You can specify the direction of the derivative. You can also specify the kernel size by parameter “ksize”.
Laplacian
It is the combination of the Sobel gradient in both directions. We will try to see the Python software development India of it with the help of some code.
Mathematical Reason
You might be thinking of how derivatives can help detect edges in an image. Let’s dive into the mathematical details of it.
As we calculate the derivative of an image, its curve changes as the different color intensities become upright.
Let me show you up through image clarification.
I am taking an example of a 1-D image which will be easier to explain.
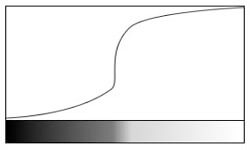
As you can see in the above figure, a simple 1-d image with black color has low intensity and white has high intensity. And above that image is its graph of intensity pixel values, and in derivatives itself, we take derivatives of the pixel matrix.
So, it will take derivate of the above image. It will like as:
A derivative of the above image shows that change in steep means detecting as an edge. But sometimes, steeps don’t represent the edge. It can be noise as well. Hence, we have to keep a threshold value to detect proper edges.
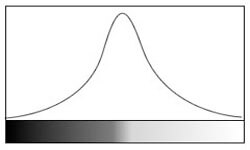
So, the Laplacian gradient works on a double derivative. It marks the edge where there are zero crossings of a single derivative and double derivative.
So, in the graph above, we have both single and double derivatives, and with the double derivative crossing at zero, you can see the point where the edge is detected.
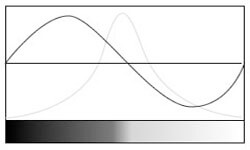
Sobel Detector
They work on single derivatives with some approximation. So, it works separately for horizontal and vertical directions. You can check it in the below example.
It chooses a different kernel for a horizontal and vertical detector.
Summarizing Laplacian and Sobel
Laplacian is computationally efficient as it uses one kernel, while Sobel uses two separate kernels. Laplacian works on double derivatives and is most precise in detecting edges, while Sobel works on single derivatives and works on approximation.
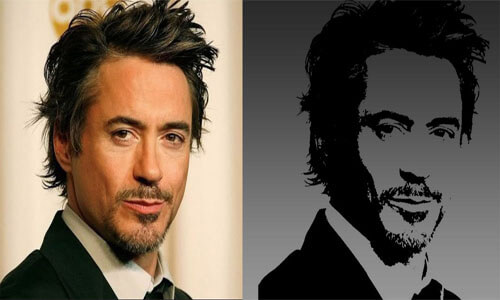
Implementing an algorithm for detecting edges in images
Input image is -:

Output image is -:
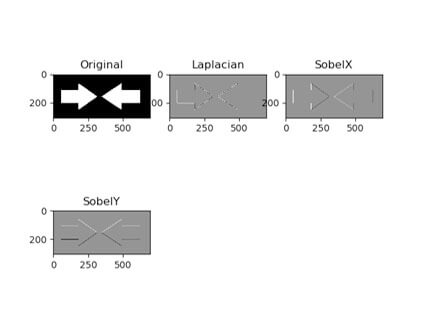
Output without gray scale -:
Important Matter
In the above implementation, we have used cv2.CV_64F, but if we change it to cv2.CV_8U then it will give different results with less edge detected.
While calculating derivative, the transition from black to white is taken as +ve slope while white to black as -ve slope. And CV_8U ignores the -ve derivative part and detects some of the edges. You can try on the above example and test out the output.
Applications
- Finding boxes in application forms
- Creating features, out of which one is edges coordinates for image classification.
Conclusion
In this tutorial, we have seen how to detect edges in an image using OpenCV functions. Keep this point in mind if you have a different version of OpenCV, you will probably get different types of images but with the same edge detection.
Apart from that, we have used cv2.CV_64F, there is another function, cv2.CV_8U, which is not able to detect all the edges, try with that as well. There is a mathematical reason behind it in cv2.CV_8U, all the -ve slopes are reduced to 0, and some information is lost.
I hope you enjoy learning! Keep up learning!

Recent Blogs
Categories