Kubernetes system basics
You must be knowing that a high level of dynamism is one of the most important aspects of a Kubernetes-based system. Almost nothing is constant. Deployments or StatefulSets are defined, and Kubernetes distributes Pods across the cluster. In most cases, those Pods are rarely stationary for an extended period. Pods are re-created and possibly moved to other nodes as a result of rolling updates. Any type of failure results in the rescheduling of the affected resources. The Pods move as a result of a variety of other events. A Kubernetes cluster is analogous to a beehive. It's vibrant and constantly in motion.
Dynamic nature of Kubernetes
- The dynamic nature of a Kubernetes cluster is caused by more than just our (human) actions or rescheduling due to failures. Autoscaling is also to blame. We should fully embrace Kubernetes' dynamic nature and strive for autonomous and self-sufficient clusters capable of serving the needs of our applications without (much) human intervention. To do so, we must provide enough information for Kubernetes to scale the applications as well as the nodes that comprise the cluster.
- The former case will be the focus of this chapter. We'll look at some of the most common and basic methods for auto-scaling Pods based on memory and CPU consumption. HorizontalPodAutoscaler will be used to accomplish this.
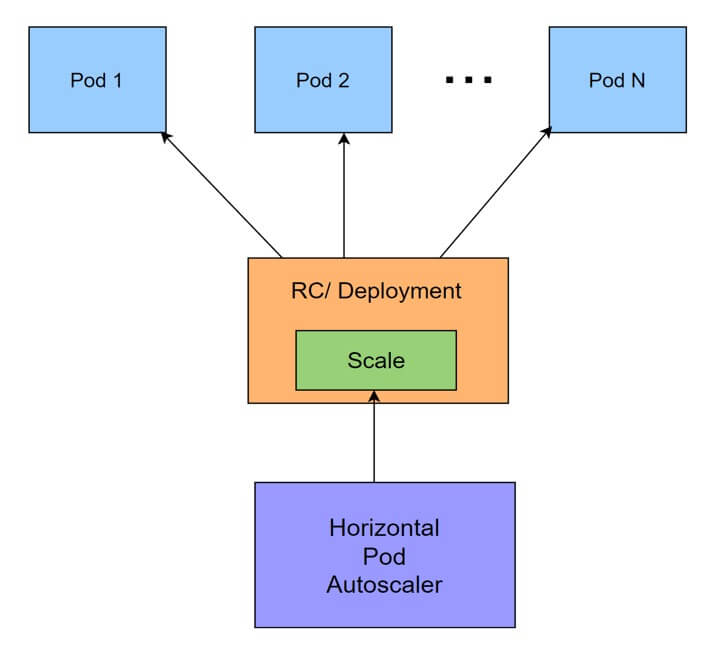
- The only function of HorizontalPodAutoscaler is to automatically scale the number of Pods in a Deployment, a StatefulSet, or a few other types of resources. It accomplishes this by monitoring the Pods' CPU and memory consumption and acting when they reach pre-defined thresholds.
- HorizontalPodAutoscaler is a controller and a Kubernetes API resource. The resource determines the controller's behavior. The controller adjusts the number of replicas in a StatefulSet or a Deployment regularly to match the observed average CPU utilization to the user-specified target.
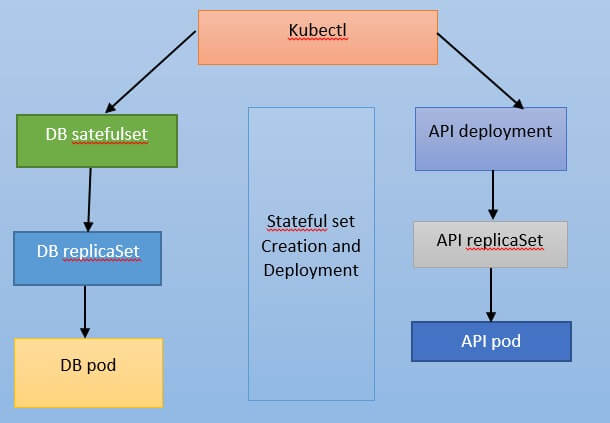
- We have two Pods that work together to form an application. The API Deployment is a backend API that stores its state in a DB StatefulSet.
- The definition's key components are resources. Both the API and the database have memory and CPU requests and limits. A sidecar container is used by the database to join MongoDB replicas into a replica set. Please keep in mind that, unlike other containers, the sidecar lacks resources. The significance of this will be revealed later. For the time being, just remember that two containers have their requests and limits defined, while the third does not.
kubectl apply -f test1.yml --record
- Create resources : Now, let’s create those resources.
kubectl apply -f scaling/aegis-demo-.yml --record
- The output should show that a large number of resources were created, and our next step is to wait until the API Deployment is completed, confirming that the application is operational.
kubectl -n aegis-demo rollout status deployment
- After a few moments, you should see a message indicating that deployment "API" was successfully deployed. To be safe, we'll list the Pods in the go-demo-5 Namespace and confirm that one replica of each is up and running.
kubectl -n aegis-demo get pods
Where to set replicas?
If the number of replicas is fixed and you do not intend to scale (or de-scale) your application over time, include replicas in your Deployment or StatefulSet definition. Use the HorizontalPodAutoscaler resource instead if you want to change the number of replicas based on memory, CPU, or other metrics.
Ex:
HorizontalPodAutoscaler is used in the definition to target the API Deployment. It has a maximum of five replicas and a minimum of two. These are fundamental constraints. We'd risk scaling up to infinity or scaling down to zero replicas if we didn't have them. The field’s minReplicas and maxReplicas serve as a safety net.
HorizontalPodAutoscaler (HPA) phases
The adoption of HorizontalPodAutoscaler (HPA) usually goes through three phases.
Phase One
The initial stage is discovery. We are usually astounded the first time we discover what it does. "Take a look at this. It automatically scales our applications. I no longer have to be concerned about the number of replicas.”
Phase Two
The second stage is the application. When we first begin using HPA, we quickly realize that scaling applications based on memory and CPU are insufficient. Some apps increase their memory and CPU usage as the load increases, while many others do not. To be more specific, not proportionally.
For some applications, HPA works well. For many others, it either does not work at all or is insufficient. We'll need to expand HPA thresholds beyond those based on memory and CPU at some point. This stage is marked by disappointment. “It seemed like a good idea at the time, but the majority of our applications are incompatible with it. We must revert to metrics-based alerts and manual changes to the number of replicas.”
Phase Three
Re-discovery is the third stage. We can see from the HPA v2 documentation (which is still in beta at the time of writing) that it allows us to extend it to almost any type of metrics and expression. Using adapters, we can connect HPAs to Prometheus or nearly any other tool. Once we've mastered that, there's almost no limit to the conditions we can set as automatic scaling triggers for our applications. The only limitation is our ability to transform data into custom metrics for Kubernetes.
The next step is to expand HorizontalPodAutoscaler definitions to include conditions based on Prometheus data. But first and foremost.
Create Cluster
Pulling the code # The vfarcic/k8s-specs repository will continue to serve as our source of Kubernetes definitions. We’ll make sure that it is up-to-date by pulling the latest version.
Using HorizontalPodAutoscaler Without Metrics Adapter
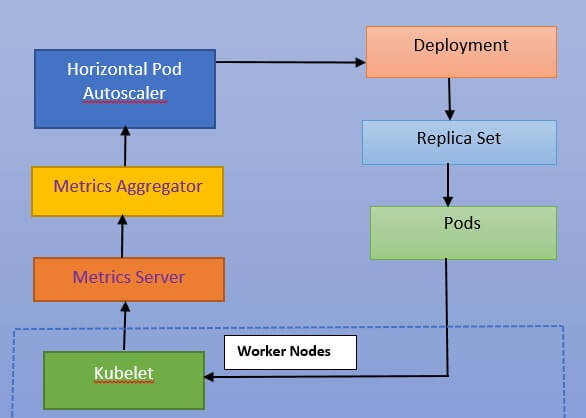
- Metrics Aggregator only knows about CPU and memory utilization connected to containers and nodes if we don't construct a Metrics Adapter. To make matters even more complicated, that information is only available for the last few minutes. We are limited to only two metrics because HorizontalPodAutoscaler (HPA) is only concerned with Pods and the containers that reside within them.
- When we build an HPA, it will scale or descale our Pods based on whether the memory or CPU consumption of the containers that make up those Pods exceeds or falls below predefined thresholds.
- Regularly, the Metrics Server retrieves information (CPU and memory) from Kubelets running inside worker nodes. In this scenario, those metrics are passed to Metrics Aggregator, which adds no value. Following that, HPAs will regularly consult the data in the Metrics Aggregator (through its API endpoint). When the target values defined in an HPA differ from the actual values, the number of replicas of a Deployment or a StatefulSet is manipulated.
- Any change to those controllers, as previously stated, causes rolling updates to be executed via the creation and manipulation of ReplicaSets (which create and delete Pods), which are converted by Kubelet running on a node where a Pod is scheduled into containers.
Create HPA based on custom metrics
The Prometheus Adapter comes with a set of default rules that offer many metrics that we don't need, but not all. By doing too much and not enough, it wastes the CPU and memory.
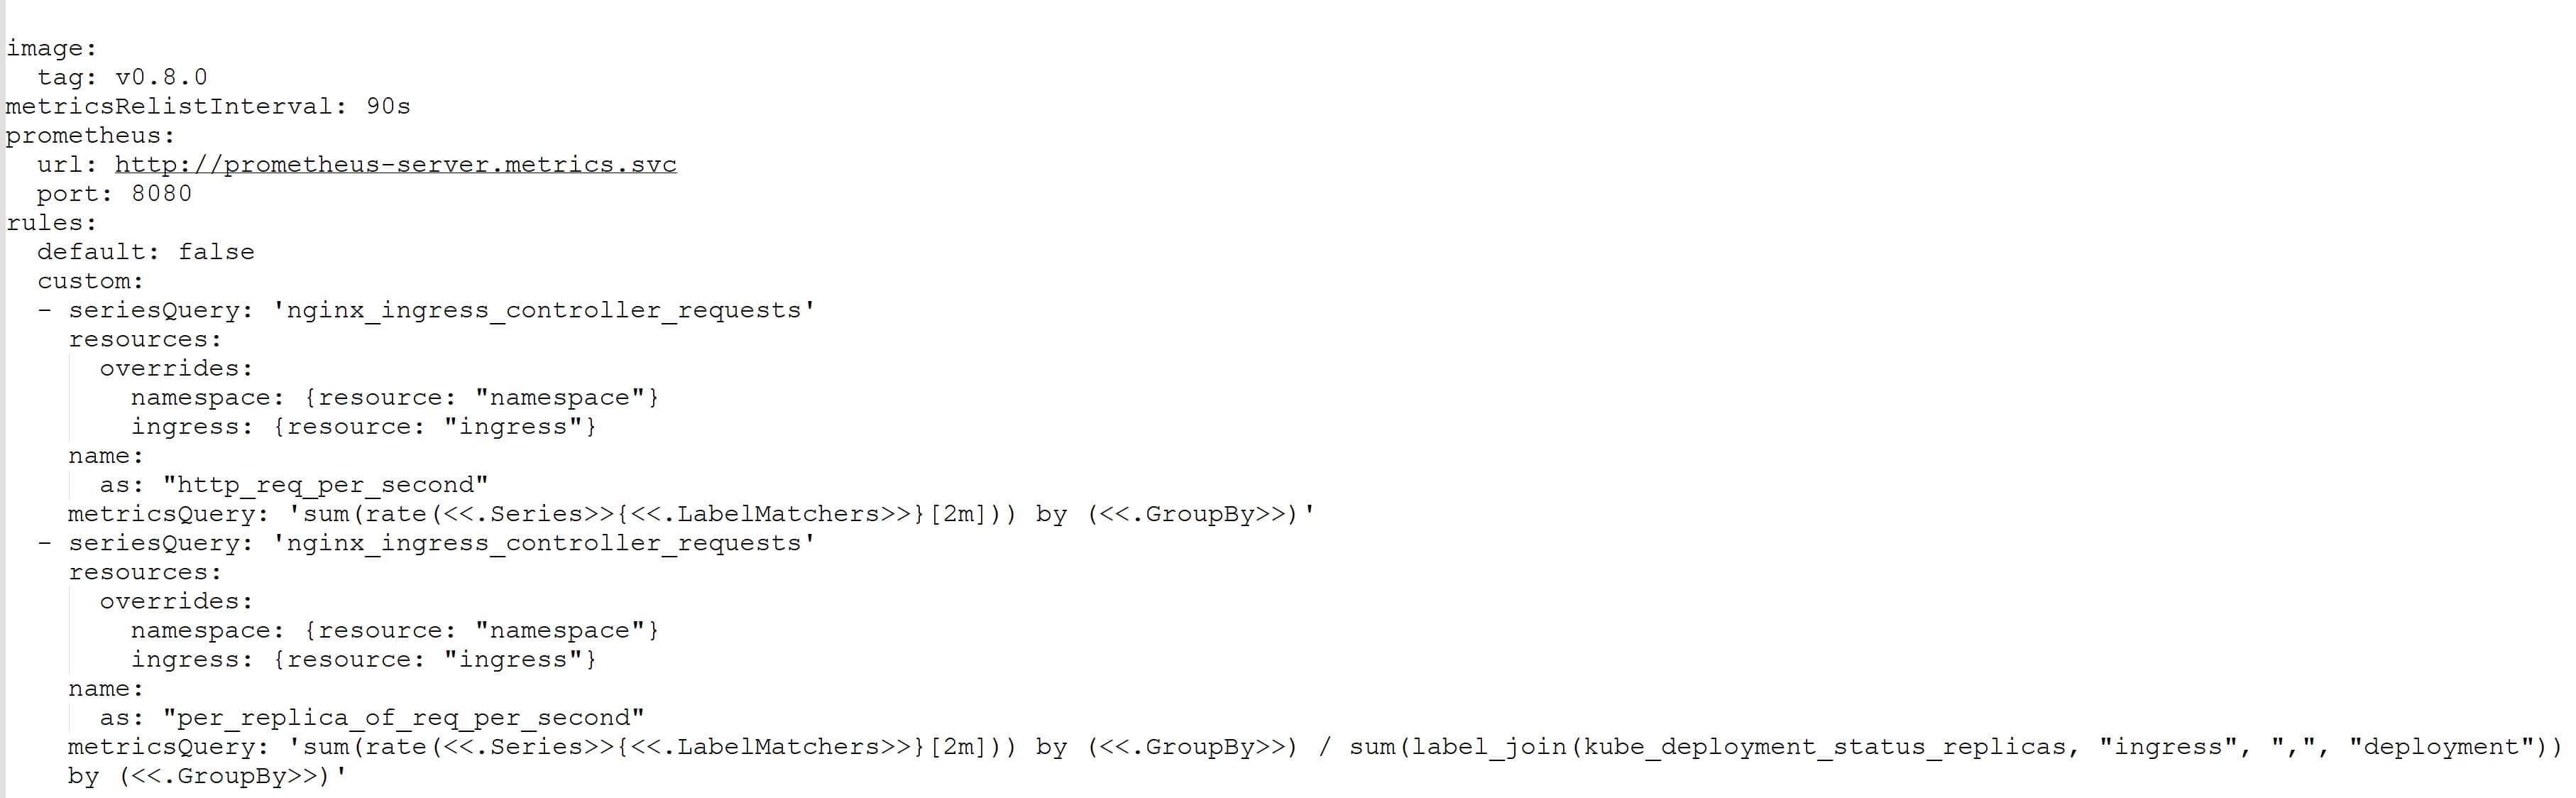
The default entry in the rules section has been changed to false. This removes the previously mentioned default rules, allowing us to start from scratch.
Custom Rules
The first rule is based on the seriesQuery value nginx ingress controller requests. The resources section's overrides entry assists the adapter in determining which Kubernetes resources are linked with the metric. The namespace label's value is set to the namespace resource. For egress, there is a comparable entry. To put it another way, we're linking Kubernetes resources like namespace and ingress to Prometheus labels.
The measure will be part of a bigger query that HPA will regard as a single metric, as you will see shortly. We need a name for our new creation because it is brand new. As a result, Expert Java developers have defined a single entry with the value HTTP req per second in the name section. That will serve as the foundation for our HPA definitions.
You already know that nginx ingress controller requests are useless on their own. When we utilized it in Prometheus, we had to wrap it in a rate function, total everything, and group the results by resource. With the metricsQuery entry, we're doing something similar.
Consider it the Prometheus equivalent of the expressions we're writing. The only distinction is that we use "special" syntax, such as. Series>>. That is the adapter's templating mechanism. We have instead of hard-coding the metric's name, labels, and group by statements. The clauses Series>>, LabelMatchers>>, and GroupBy>> will be populated with the correct values based on what we put in API calls.
It had been five minutes since I had sent a hundred requests. If it didn't, congrats on being a quick reader; but, you'll have to wait a bit longer before we send another hundred requests. We're ready to release our first HorizontalPodAutoscaler (HPA) based on custom metrics, and I'd like to show you how it works both before and after it's turned on.
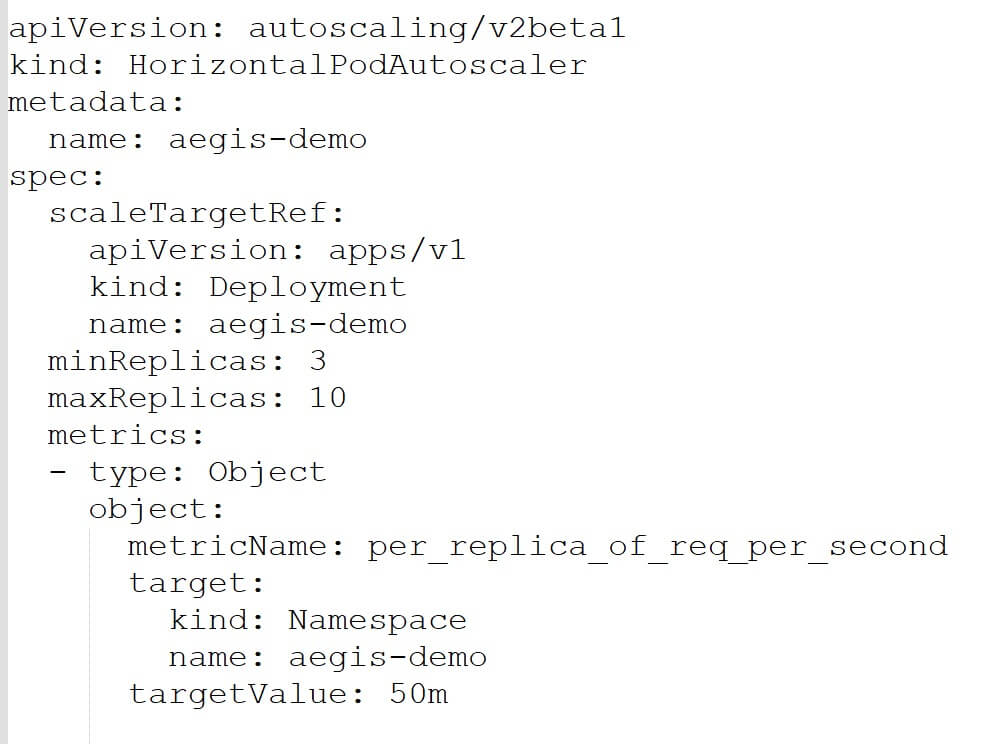
Because it is similar to what we used previously, the first half of the definition should be familiar. It can store three to ten copies of the aegis-demo Deployment. The new content is available in the metrics section.
Previously, spec.metrics.type = Resource was used. That type was used to provide CPU and memory objectives. However, this time our type is Object. It refers to a metric that describes a single Kubernetes object, in this case, a custom Prometheus metric.
The fields of the Object type differ from those of the Resources type, as can be seen. The Prometheus Adapter metric is used as the metricName (HTTP req per second per replica). Remember that the adapter will utilize an expression to get data from Prometheus and convert it to a custom measure, not a metric. In this scenario, we get the number of requests received by an Ingress resource divided by the number of Deployment replicas.
kubectl -n aegis-demo apply -f aegis-demo-hpa-ing.yml
Following that, we'll describe the newly formed HPA and see if we can find anything noteworthy.
kubectl -n aegis-demo describe hpa aegis-demo
Ouput:
Min replicas: 3
Max replicas: 10
In the Metrics section, we can see that there is only one entry. Based on Namespace/go-demo-5, the HPA employs the custom metric HTTP req per second per replica. The aim is 0.05 requests per second, while the present value is zero. If the current value is unknown in your situation, please wait a few moments before re-running the command.
We can see that both the existing and intended number of Deployment Pods are set to three farther down.
The HPA is not compelled to intervene because the goal has not been met (there are 0 requests). The number of replicas is kept to a bare minimum.
Let's add some spice by driving some traffic.
We sent 70 requests to the aegis-demo Ingress. Let’s describe the HPA again, and see whether there are some changes with this command: kubectl -n aegis-demo describe hpa aegis-demo:
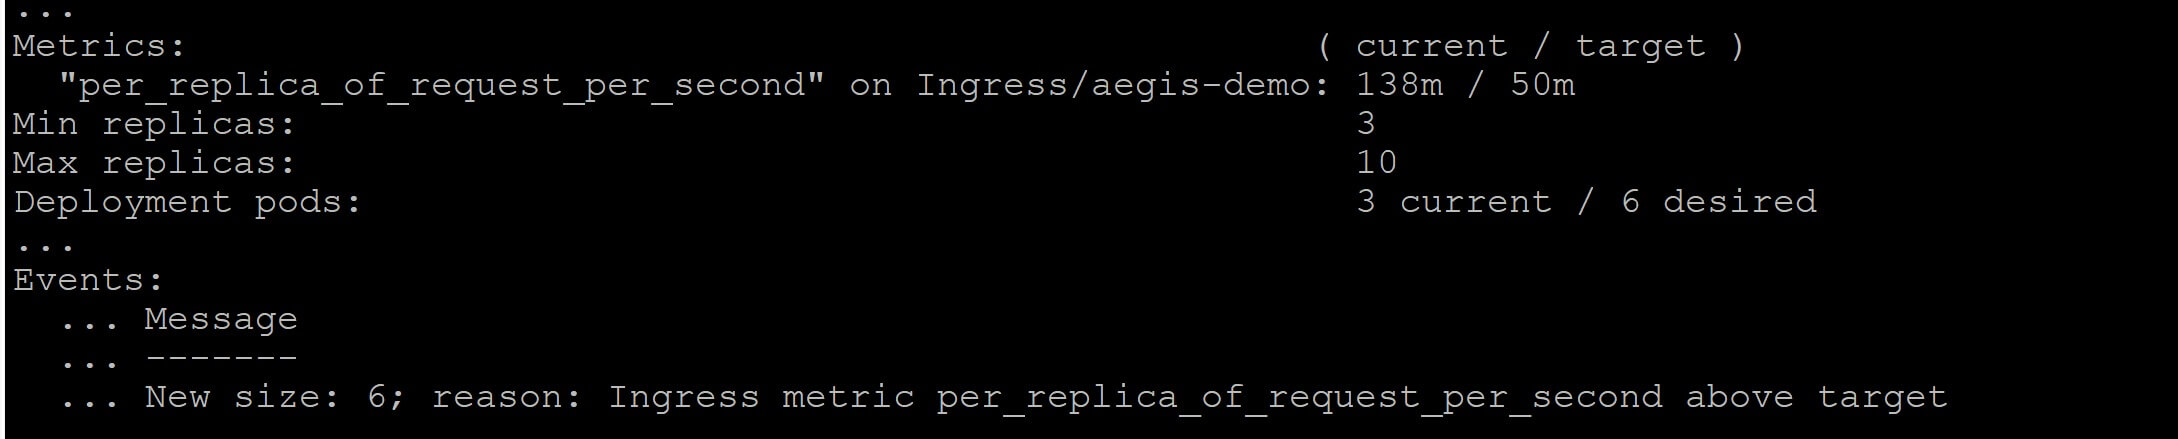
The current value of the metric has increased, as can be seen. In my instance, it's 138m (0.138 requests per second). If your output remains zero, wait until Prometheus pulls the metrics, the adapter collects them, and the HPA refreshes its status. Wait a few moments before re-running the preceding command, in other words.
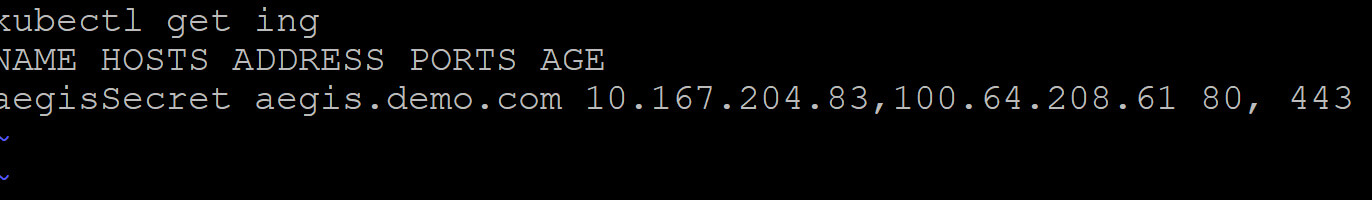
Ingress Configuration:
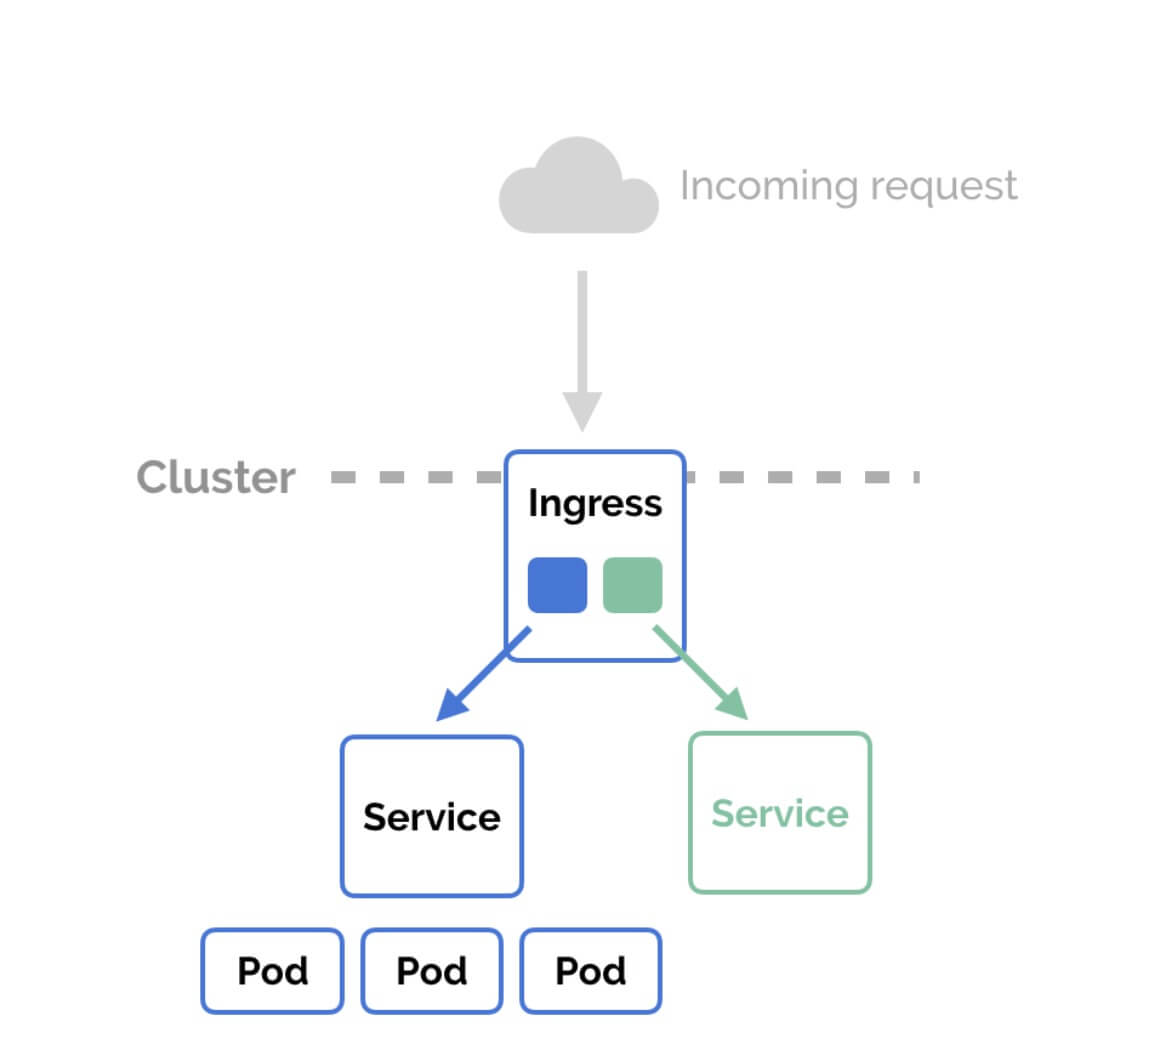
Ingress offers HTTP and HTTPS routes to services within the cluster from outside the cluster. Rules specified on the Ingress resource control traffic routing.
An Ingress can be set up to provide Services with externally accessible URLs, load balance traffic, terminate SSL/TLS, and provide name-based virtual hosting. The Ingress is fulfilled by an Ingress controller, which is commonly a load balancer. A NSX-T ingress controller is embedded into every NSX-T PKS cluster. For external access, apps just need to build Ingress objects.
This will be a default ingress part of every cluster.
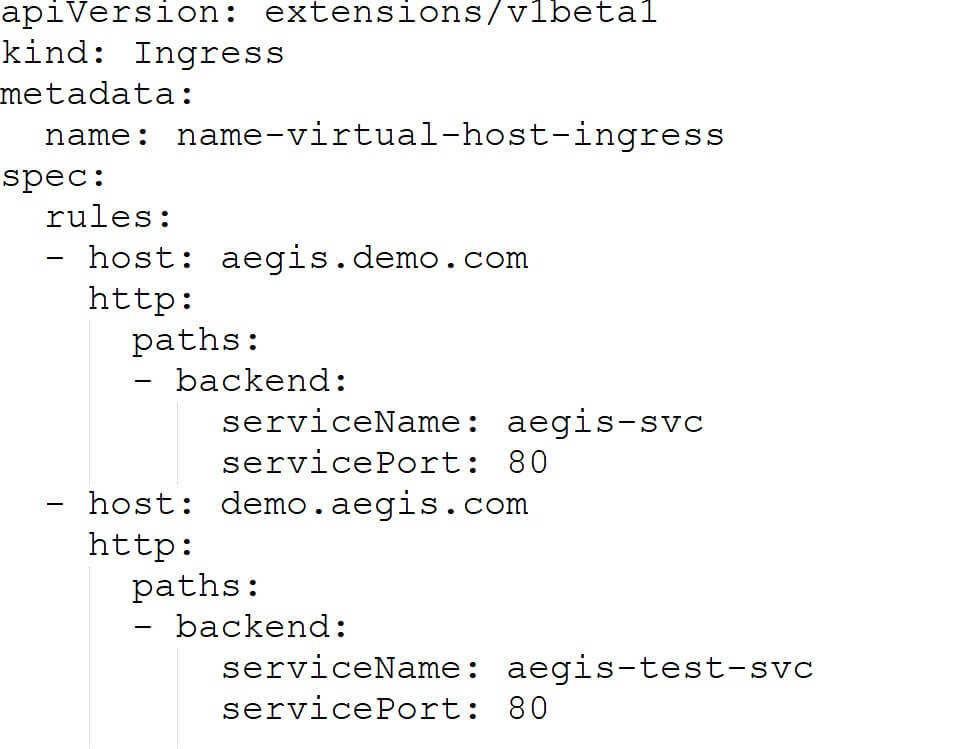
Hostname Based Routing Concepts:
HTTP traffic can be routed to numerous host names at the same IP address using name-based virtual hosts.
URI Based Routing
Based on the HTTP URI being requested, a fanout configuration sends traffic from a single IP address to any Services.
The paths /test and /test1 will be rewritten to / before the URL is sent to the backend service.
SSL Certificate Creation Steps:
- You must first build a Kubernetes TLS secret that will be used in the ingress before you can construct an HTTPS Ingress.
- SSL certificate for aegis.demo.com: (If you already have a CA certificate and key, you may skip this step.):
Generate self-signed cert
- openssl req -x509 -nodes -days 365 -newkey rsa:2048 -keyout /tmp/tls.key -out /tmp/tls.crt -subj "/CN=aegis.demo.com"
- Store SSL cert and key in secret : kubectl create secret tls foo-secret --key /tmp/tls.key --cert /tmp/tls.crt
TLS Ingress Yaml file
Output:

Recent Blogs
Categories